Page scan and logs
Page Scan is a built-in auditing tool that analyses a single page against industry-standard metrics. It produces scores and actionable recommendations across performance, accessibility, best practices, and SEO, so you can identify and resolve quality issues before they reach end-users.
For a broader view of monitoring capabilities, refer to Performance monitoring overview.
Run a page scan
-
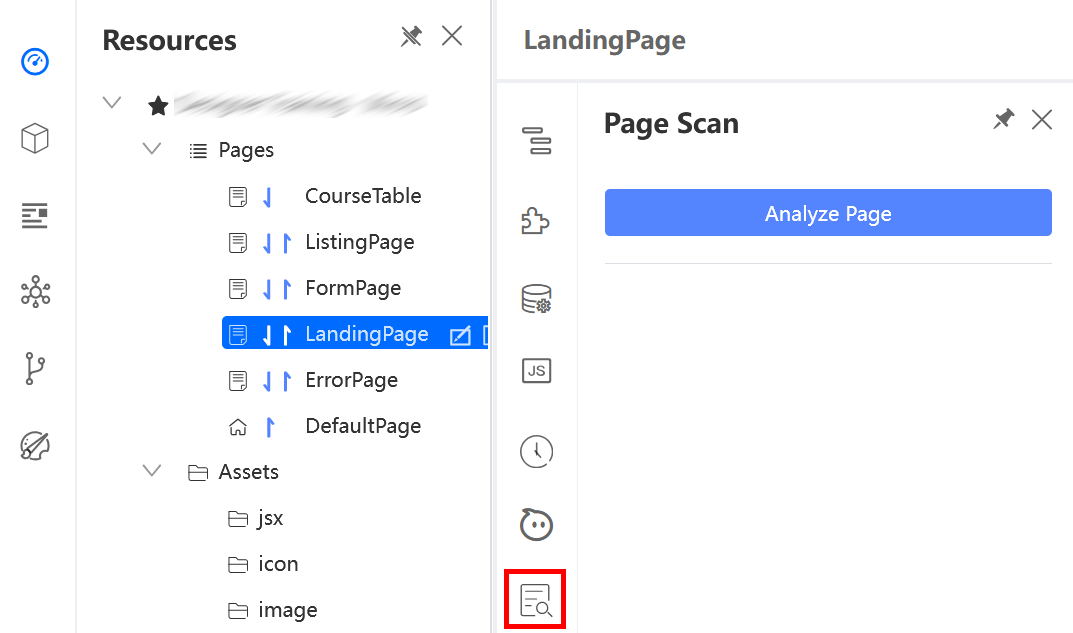
Open the Page Scan plugin: In the App Designer, open the page you want to analyse. On the mid-left toolbar, click the Page Scan icon.
-
Start the analysis: Click Analyze Page. The tool scans the page structure, assets, and performance characteristics. This may take a few moments depending on the page complexity.
Interpret the scores
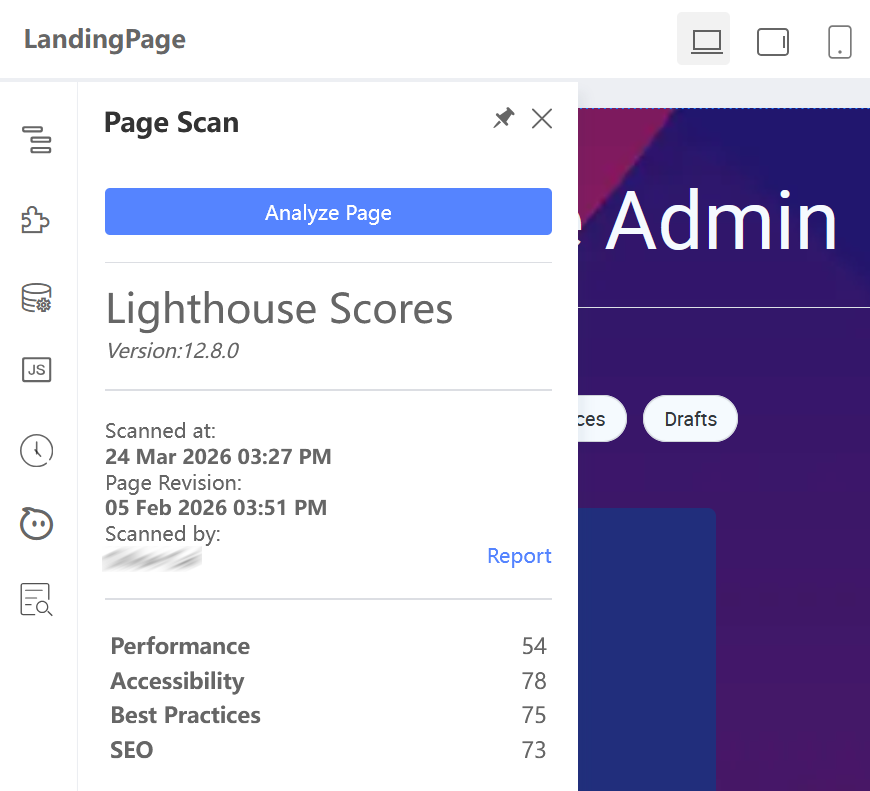
Once the scan completes, a summary report appears directly in the Page Scan panel. It displays the scan timestamp, page revision, and scores (out of 100) for four categories:
| Category | What It Measures |
|---|---|
| Performance | How quickly the page loads and becomes interactive. Evaluates metrics such as First Contentful Paint, Largest Contentful Paint, and Speed Index. |
| Accessibility | How usable the page is for people with disabilities. Checks colour contrast, ARIA attributes, keyboard navigation, and semantic HTML. |
| Best Practices | Adherence to modern web development standards, including HTTPS usage, avoidance of deprecated APIs, and proper image aspect ratios. |
| SEO | How well the page is optimised for search engines. Checks for meta descriptions, title tags, crawlable links, and legible font sizes. |
Download and review the full report
For a detailed breakdown, click the Report link in the Page Scan panel to download the full Lighthouse report. The report expands each category into individual metrics and diagnostics, for example:
- First Contentful Paint: Time until the first text or image appears.
- Largest Contentful Paint: Time until the largest visible element renders.
- Total Blocking Time: Total time the main thread was blocked and unable to respond to user input.
- Cumulative Layout Shift: How much the page layout shifts unexpectedly during loading.
- Speed Index: How quickly the visible content of the page is populated.
Each flagged issue includes a description of the problem and a recommendation for how to fix it. Use these recommendations to make targeted improvements, such as compressing images to reduce load times or adding alt text to improve accessibility.
Last updated on 20 May 2026